Emerging markets are increasingly turning to domestic debt issuance, marking a structural shift from reliance on external, hard currency borrowing. This evolution reflects deeper local markets, rising incomes, and stronger institutions in many countries. Growth in local markets varies widely across the EM universe, shaped by governance quality and economic development. Improvement in governance is likely to precede sustainable growth of a country’s domestic debt market, and the following analysis highlights where local markets are thriving—and where they lag. This development carries notable economic implications and is creating opportunities in EM local and hard currency markets as explored in recent posts and expanded upon below.1
For decades, many emerging markets had no choice but borrow in foreign currency—a dependency economists famously called the “original sin.”2 In the early 1990s, public and publicly-guaranteed debt in low income countries exceeded 75% of GDP, according to a 2024 IMF study.3 More than half of this was concessional foreign debt (i.e., in foreign currency, but at below-market cost), while domestic debt accounted for barely 10% of GDP.
As economies developed, rising income and savings fueled the growth of domestic financial markets, providing governments and private borrowers with access to local financing, thereby gradually shifting debt compositions. The trend accelerated during and after the pandemic as fiscal deficits increased, though many lower-income countries faced prohibitively high external borrowing costs. Today, domestic debt in the same group of countries exceeds 20% of GDP, with more advanced EMs exhibiting even higher shares.4
Why Local Debt Matters
On one hand, high domestic debt in less developed countries can strain debt sustainability, erode policy credibility, and crowd out private sector financing.5 On the other hand, a deep local market boosts domestic borrowing, reduces the strain on FX reserves (sometimes used to repay external debt), mitigates currency risk, and enhances financial stability (through more stable currency and inflation), which can then bolster investor confidence.
However, the emerging market universe is diverse and economic policies and strategic incentives are far from uniform. Some countries continue to issue externally, despite ample domestic savings, while others rely almost entirely on local markets. Economic fundamentals (e.g., degree of monetization, income growth, and savings rates) drive market growth and divergence, but institutional strength (i.e., independent central banks, sound regulation, and the rule of law) is also critical and a key determinant of how quickly local markets grow.
Mapping Development and Debt Composition
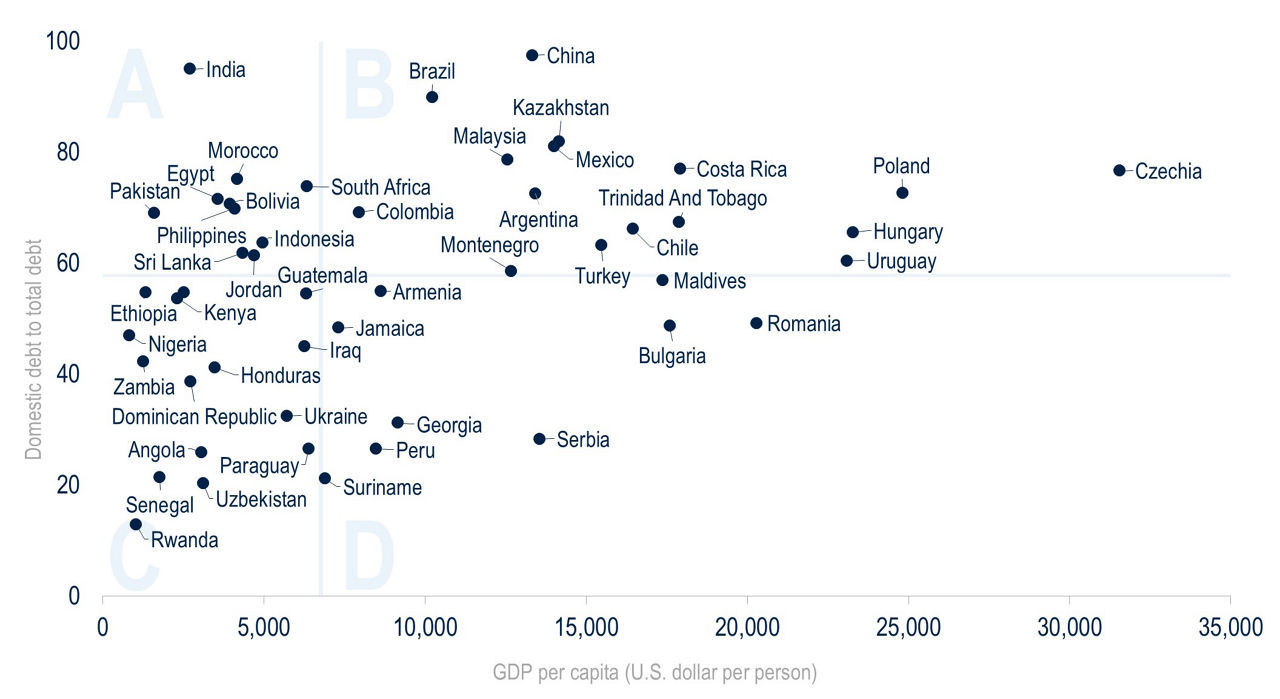
To explore these dynamics, we compare GDP per capita—a proxy for economic development—with the share of domestic versus external debt across EMs.6 Using median values, we divide countries into four quadrants (Figure 1).7
Figure 1
Share of Domestic Government Debt (%) vs. GDP Per Capita
Source: Haver, World Bank. As of September 2025.
- Quadrant A: Domestic debt is higher than expected for the level of development in these countries. Clearly, the risk level is different from country to country, but institutional strength often compensates for lower income. For example, Egypt and South Africa maintain credible central banks and robust legal frameworks, supporting local bond markets and attracting external investors.
- Quadrants B and C: These countries show the expected positive relationship—higher income correlates with deeper local markets.
- Quadrant D: Despite higher income, these local markets remain underdeveloped, leaving countries reliant on external debt. This reflects varying degrees of risk, but may also be explained by other “soft,” or qualitative factors.
The Institutional Factor
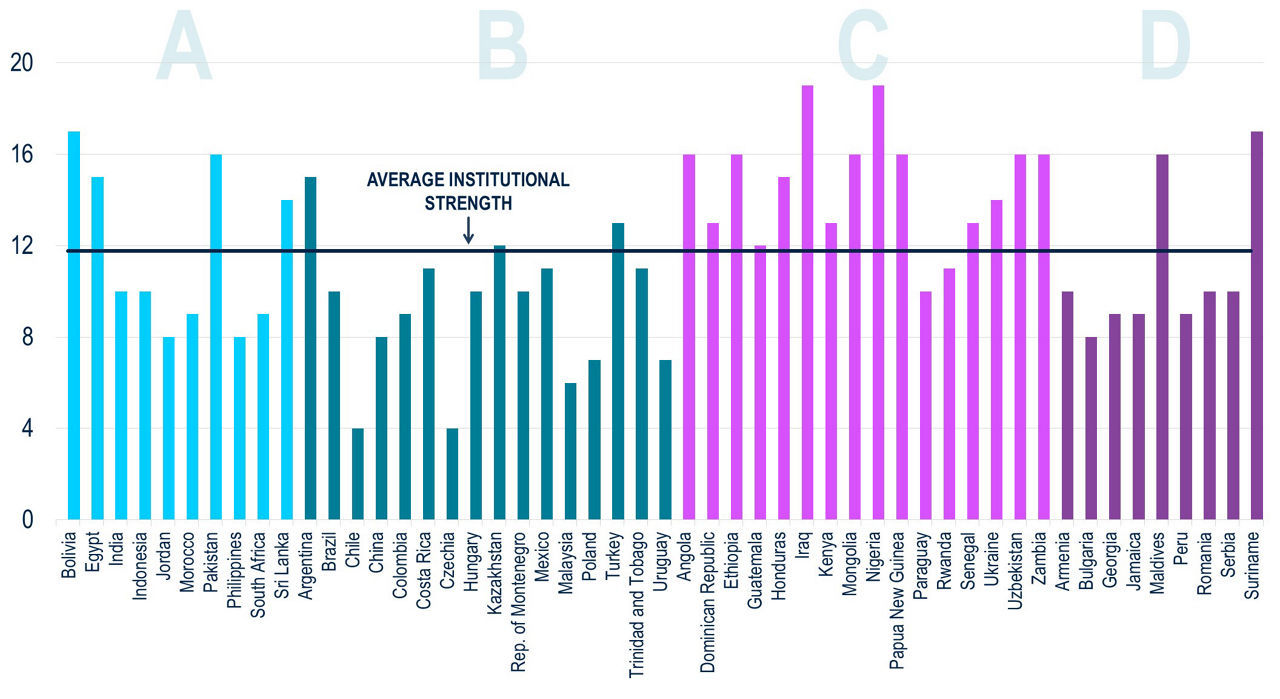
To quantify institutional strength, we use Moody’s “Institutions and Governance Strength” factor score used in their sovereign rating methodology, which captures the quality of legislative and executive institutions, civil society, judiciary strength, and policy effectiveness (including fiscal, monetary, and other macroeconomic policies).8
A clear pattern emerges when overlaying these metrics across the countries in our four quadrants. Among lower-income countries (quadrants A and C), institutional strength is stronger on average in quadrant A—aligning with their higher-than-expected share of domestic debt. Conversely, in higher-income countries (quadrants B and D) institutional strength is slightly weaker in quadrant D, which is consistent with their lower-than-expected share of domestic debt (Figure 2). The correlation between institutional strength and domestic debt share is -0.39—moderate, but meaningful.
Figure 2
Institutional Strength by Quadrant (lower scores indicate stronger institutions)
Source: Moody’s, Haver, World Bank. As of September 2025. Scores are calibrated to government track record.
It is important to note that this relationship is not absolute. For example, Romania (quadrant D and an EU member) boasts stronger institutions than Turkey (quadrant B), yet its local markets are smaller. Such cases underscore the need for more nuanced, country-specific analysis.
Looking Ahead: Opportunities and Risks
Local debt will likely become an even more important financing source for EMs and an increasingly attractive asset class for all investors. The key question thus becomes: which countries, and when, will see higher and more sustainable growth in domestic debt markets? As an example, one might refer to countries with relatively high institutional strength and room for domestic market expansion. Indeed, strengthening governance should precede market deepening, and monitoring improvements in countries with a lower-than-expected share of domestic debt will be indicative of countries’ evolving debt dynamics.
For investors, tracking improvements in fiscal policy, central bank frameworks and independence, and the regulatory environment could create opportunities within the hard currency and local currency markets. On the hard currency side, a shift toward local borrowing can create a “scarcity effect” in external markets, supporting demand for hard currency bonds. We explored this dynamic in a recent blog focusing on the effects of rising local issuance in Asia and its effects on the region’s hard currency spreads.
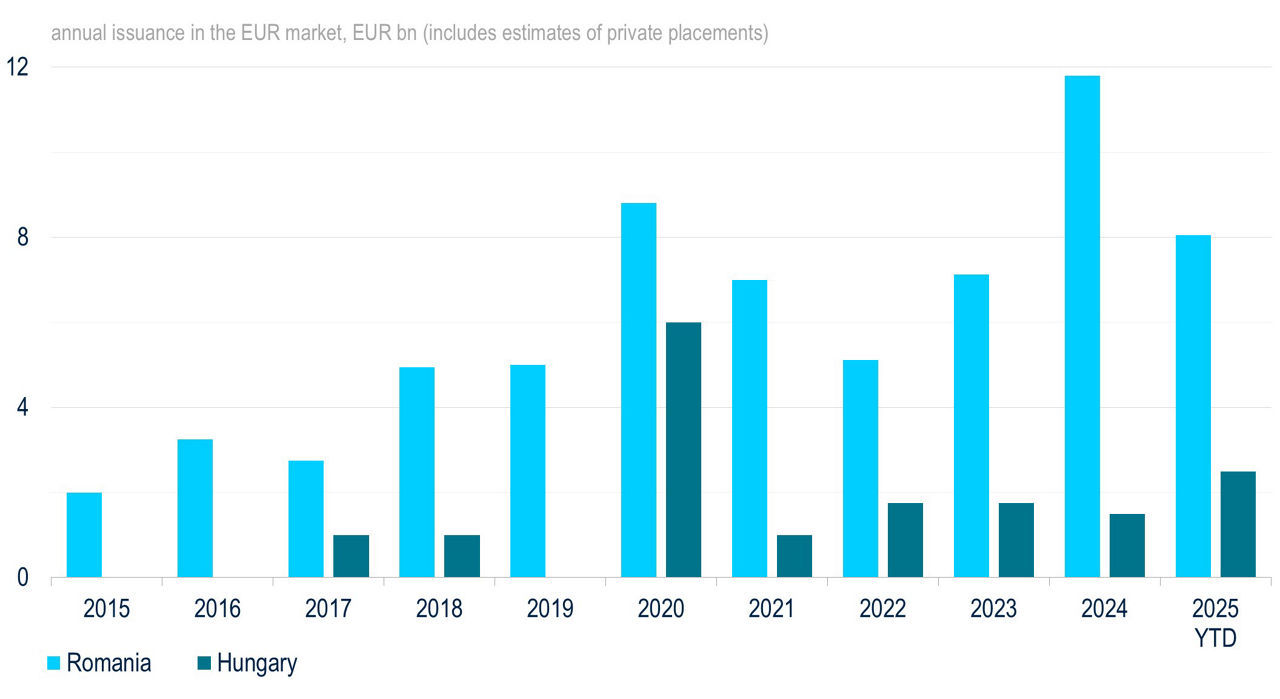
As another example of the inter-market dynamic, Figure 3 shows that Romania (Figure 1 quadrant D) issues significantly more hard-currency debt than similarly-rated Hungary (Figure 1 quadrant B).
Figure 3
Hungary Issues Significantly Less Hard Currency
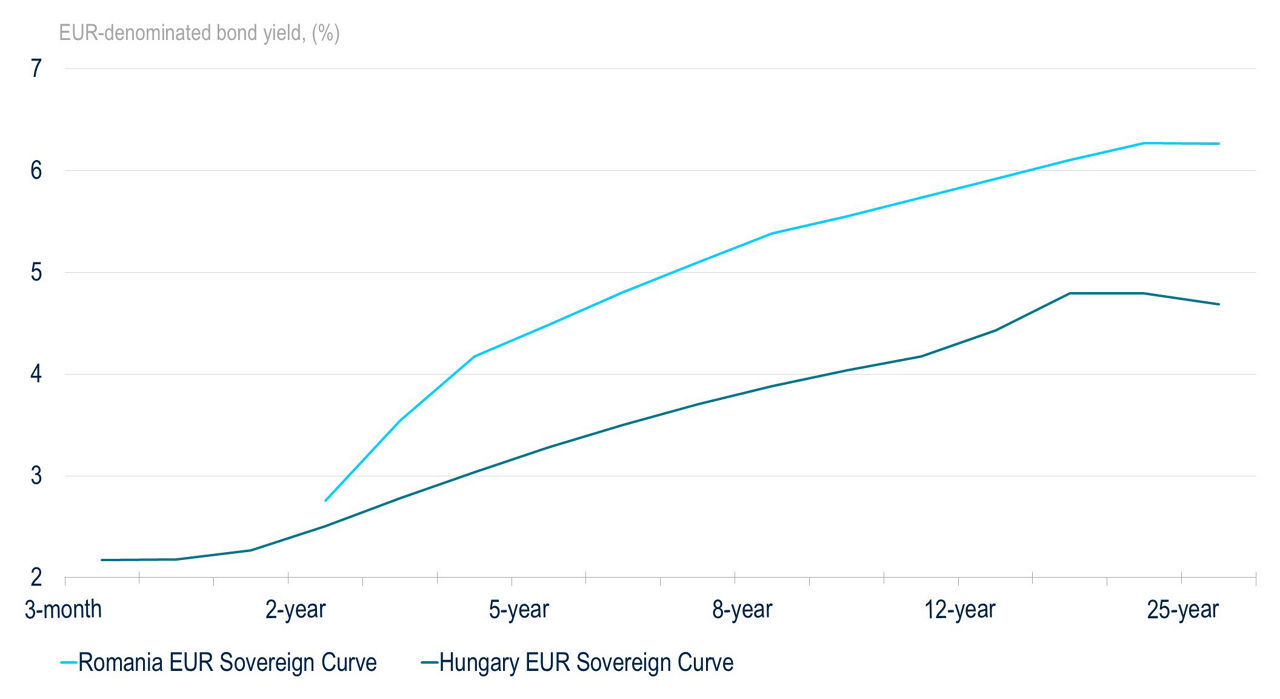
With that context—and the greater stock of Romanian EUR-denominated debt—Figure 4 shows that Romania’s cost of capital in euros is significantly higher than Hungary’s. Hence, the investment implications as investors weigh the EUR-yield differentials and the countries’ borrowing profiles amongst other investment considerations.
Figure 4
Hungary’s Euro Issuance Costs Remain Well Below Romania’s Despite Similar Ratings
On the local currency side, higher shares of domestic debt increase the liquidity and transparency (and ultimately the efficiency) of local markets, which can remove hurdles to investing in local EM assets by external investors.
Higher, more sustainable growth in domestic debt markets is just one of several factors to be considered before investing in an EM country. While fiscal discipline, inflation control, exchange rate regime, and regulations remain crucial determinants of a country’s fundamental profile, the developing dynamic between local and hard currency markets adds another consideration to the alpha opportunities across the EMD sector.
1 “Five Factors Supporting Asian Credit Spreads,” PGIM.com, August 12, 2025.
2 Barry Eichengreen, Ricardo Hausmann, Ugo Panizza, “Currency Mismatches, Debt Intolerance and Original Sin: Why They Are Not the Same and Why it Matters,” 2003.
3 International Monetary Fund and World Bank, "Macroeconomic Developments and Prospects For Low-Income Countries—2024," Policy Papers 2024.
4 We define domestic debt as liabilities owed to residents of the country, typically issued in local currency under domestic law.
5 S.M. Ali Abbas & Jakob Christensen, “The Role of Domestic Debt Markets in Economic Growth: An Empirical Investigation for Low-Income Countries and Emerging Markets,” 2007.
6 We use GDP per capita as it reflects various aspects of a country’s development, such as income levels, living standards, financial market development, structural characteristics, etc. in a single variable.
7 Defined as countries in the JP Morgan EMBI index with available data excluding GCC countries and dollarized economies (Ecuador, Panama, El Salvador).
8 Moody’s Rating Methodology, 2022.
References to specific securities and their issuers are for illustrative purposes only and are not intended and should not be interpreted as recommendations to purchase or sell such securities. The securities referenced may or may not be held in the portfolio at the time of publication and, if such securities are held, no representation is being made that such securities will continue to be held.
The views expressed herein are those of PGIM investment professionals at the time the comments were made, may not be reflective of their current opinions, and are subject to change without notice. Neither the information contained herein nor any opinion expressed shall be construed to constitute investment advice or an offer to sell or a solicitation to buy any securities mentioned herein. Neither PFI, its affiliates, nor their licensed sales professionals render tax or legal advice. Clients should consult with their attorney, accountant, and/or tax professional for advice concerning their particular situation. Certain information in this commentary has been obtained from sources believed to be reliable as of the date presented; however, we cannot guarantee the accuracy of such information, assure its completeness, or warrant such information will not be changed. The information contained herein is current as of the date of issuance (or such earlier date as referenced herein) and is subject to change without notice. The manager has no obligation to update any or all such information; nor do we make any express or implied warranties or representations as to the completeness or accuracy.
Any projections or forecasts presented herein are subject to change without notice. Actual data will vary and may not be reflected here. Projections and forecasts are subject to high levels of uncertainty. Accordingly, any projections or forecasts should be viewed as merely representative of a broad range of possible outcomes. Projections or forecasts are estimated based on assumptions, subject to significant revision, and may change materially as economic and market conditions change.
4898585


